

Triangle Distribution app for iPhone and iPad
Developer: Donald Schaefer
First release : 04 Sep 2016
App size: 1.1 Mb
The Triangular Distribution is a continuous probability distribution with a probability density function shaped like a triangle. It is defined by three values: the minimum value a, the maximum value b, and the mode value c where a < b and a ≤ c ≤ b.
The triangular distribution is typically used as a subjective description of a population for which there is only limited sample data, and especially in cases where the relationship between variables is known but data is scarce (possibly because of the high cost of collection). It is based on a knowledge of the minimum and maximum and an estimate as to the modal value.
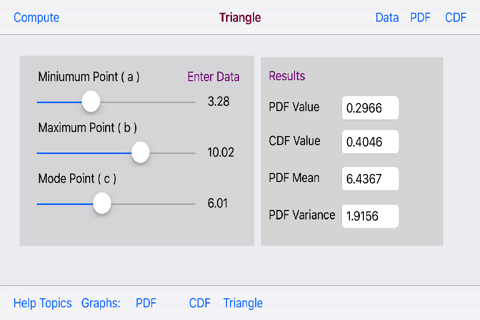
Three numeric data input fields exist for the entry of the three data parameters for the Triangle Distribution: the Minimum Value (a), the Maximum Value (b) and the Mode Parameter (c) where where a < b and a ≤ c ≤ b.
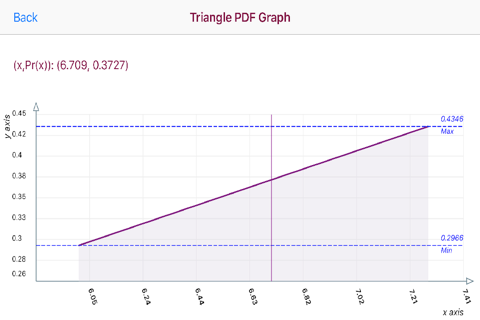
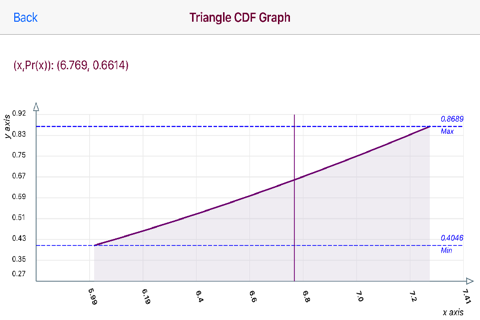
The PDF and CDF graphs are touch interactive graphs for computed (x/Pr(x) paired values. The graphs hav a touch feature whereby upon the touch a slidable vertical line appears. Upon movement of the line a paired (x,Pr(x) values appear relative to the line position on the graph curve.
The horizontal x-axis displays computed (x) values. The vertical y-axis plots a range of Pr(X) values.
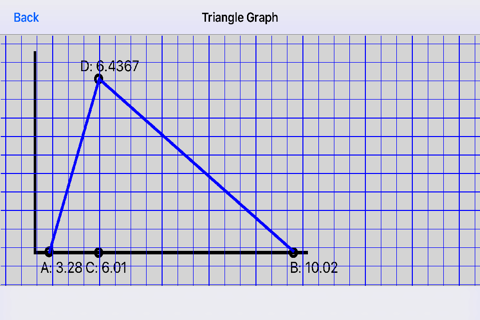
A Triangle Graph displays the Triangle with Minimum Value, Maximum Value, Mode Value and PDF Mean Value.